
JF Ptak Science Books Post 1226
 I've included this post in the Blank/Missing/Empty thread of this blog because the Federal minimum wage has been proportionally increased more so in th e last two years than at almost any time in its history, the increases really only get it up to what it niormally has been, maybe a little higher, with CPI-adjusted. This post is in response to an article in the New York Times today saying that the new minimum wage is equal to that of 1968, which is probably accurate. The real point is that during the mid- Clinton years and the early Bush yeras the minimum wage languished during a time of tremendous growth for those who already had money--the poor for the years of 1992-2005 were left largely unprotected, unmolested by fortune.
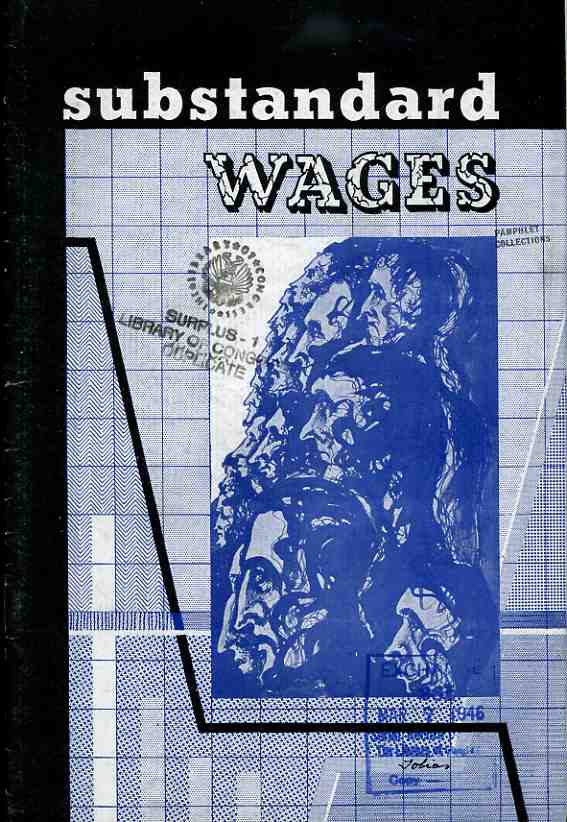
Leafing my way through this interesting pamphlet, Substandard Wage, an Analysis of their Extent and Effect, and What Must be Done to Establish a Higher Wage Level, design “and presentation” by Abraham Joel Tobias for the Textile Workers Union of America, CIO, and for the Congress of Industrial Organizations, I found some very interesting bits. First of all, the work was done to aid the working poor, people who were employed and making a wage, but the wage just wasn’t enough necessarily to being them out of poverty. (The poverty line wasn’t invented as an economic bell weather until 1959.) The first of the working poor that I read about was a librarian, Marga Kortenbeutel* (of the NYPL) who was working for $1,440.00 a year in 1945, which was just keeping her barely afloat, what with cutting out her 89-cent lunches and all. That’s the equivalent (CPI adjusted) to about $17,500 a year in 2008 dollars. Of course, the general economy was not doing well during the war, though it would rebound substantially by the late ‘40’s. The minimum wage, first established in 1938, was equal to about $3.50 2008n dollars in 1945. By 1950 this jumps to $6.25, and from there to about 1988 the minimum wage stays at at least that rate, with the period 1958-1978 soking aqt an average of about $8.hour. From 1988 forward the minimum wage falls, winding up at about 5 dollars/hour in 2008, with the period 2003-2008 being the lowest level of real wages since World War II.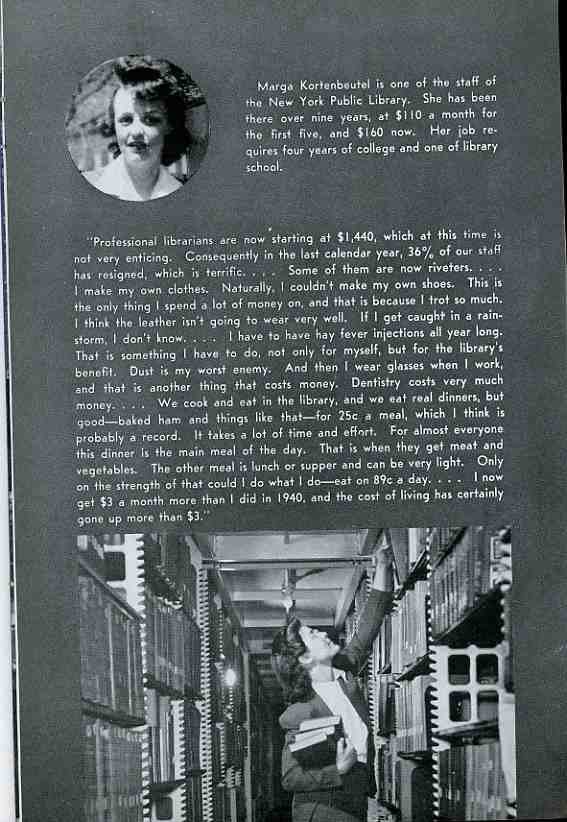
But what was this in terms of the rest of the population; what did these figures for minimum wages mean in the society at large? Was this a livable wage? If we define “livable” as above what the government considered to be the “poverty level”, and “working” is a 40-hour work week and a 50-week working year, the answer is a quick “no”. In 1959, when the poverty level was established, the minimum wage for the working person brought them to 67% of the income necessary to be “poor”; that left a gap of 33%, and that isn’t good. That gap continued to close to 1968, when minimum wage go to within 10% of the poverty level, and then it began a slow and steady-ish decline. The spiral down bottomed out for a bit in 1989, when it hit 52%, building back up to just a touch over 60% in 1997. From 1997 until the new minimum wage was instituted in 2006, the gap widened steadily, hitting 50%. In 2008, with the new minimum wage in place , the gap is still at 41%, meaning that the new wage levels still only come to within 59% of what is supposed to be the poor line in the United States. 59% stops things from being a ridiculous slap in the face of American working poor, but not by much. And it affects too few: the minimum wage applied to a high of about 17% of the entire working population in the U.S. in 1979; today, the minimum wage which gets the working poor a little more than half-way to poor, applies to only 2.5% of the population.
*As it runs out, I found a little bit about Ms. Koretenbeutel; at the time of the publication of this pamphlet, Margathe was 35 years old. She married someone named Voorhis in 1960, and died in 1971. That’s all I’ve got.
The image below is from the back cover of the pamphlet, described as a "lithograph by Tobias".

A Timeline of Minimum Wage Levels, 1938-2009 (in continued reading section)
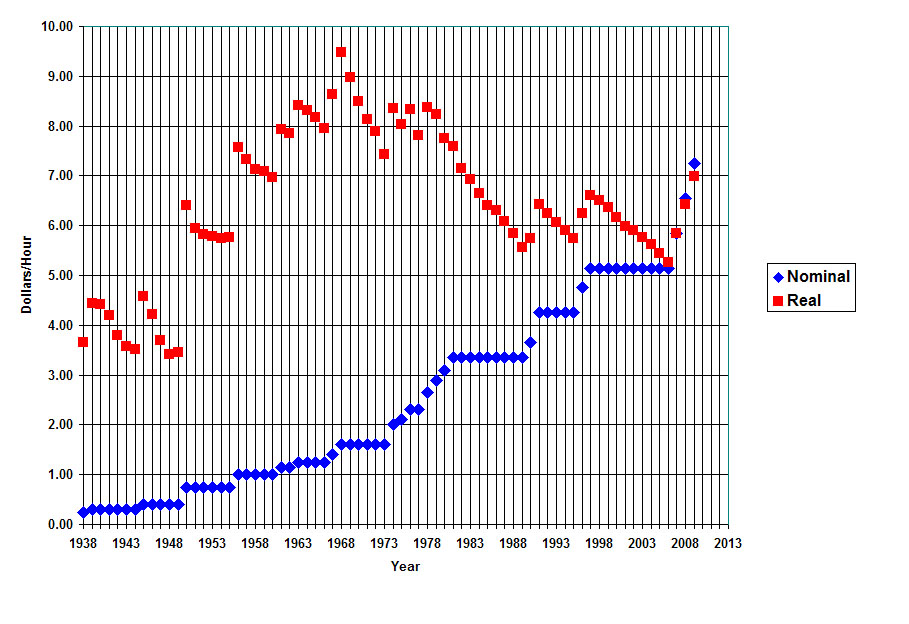 The graph, above, is from Oregon State University website on the history of the minimum wage. The accompanying text to it is also below. The graph depicts "nominal" versus "real" minimum wages by year, the red dots (the nominal) showing what the original minimum wage translated to in 2008 dollars.
A federal minimum wage was first set in 1938. The graph shows nominal (blue diamonds) and real (red squares) minimum wage values. Nominal values range from $0.25/hr in 1938 to $6.55/hr as of July 2008. The graph adjusts these wages to 2007 dollars (red squares) to show the real value of the minimum wage. Calculated in real 2007 dollars, the 1968 minimum wage was the highest at $9.47. The real dollar minimum wage (red squares) falls during periods Congress does not raise the minimum wage to keep up with inflation. The period 1997-2007, is the longest period during which the minimum wage has not been adjusted. The minimum wage increases in three $0.70 increments--to $5.85 in 2007, $6.55 in mid 2008, and to $7.25 in mid 2009. The real values after 2007 are projected for future decline in purchasing power.

[Graph from Wikipedia on the minimum wage, here]
And this interesting graph from MotherJones, showing what the minimum wage would look like if it had kept pace with the salary increases for the top one percent:

Here's a list of the changes to the minimum wage--as it turns out 14 increases came under Democrat presidencies and 9 under Republican:
Oct 24, 1938$0.25
Oct 24, 1939 $0.30
Oct 24, 1945 $0.40
Jan 25, 1950 $0.75
Mar 1, 1956 $1.00
Sep 3, 1961 $1.15
Sep 3, 1963 $1.25
Sep 3, 1964 $1.15
Sep 3, 1965 $1.25
Feb 1, 1967 $1.40
Feb 1, 1971 $1.60
May 1, 1974 $2.00
Jan. 1, 1975 $2.10
Jan 1, 1976 $2.30
Jan 1, 1979 $2.90
Jan 1, 1980 $3.10
Jan 1, 198 $3.35
Apr 1, 1990 $3.80
Apr 1, 1991 $4.25
Oct 1, 1996$4.75
Sep 1, 1997 $5.15
Jul 24, 2006 $5.85
Jul 24, 2008 $6.55
Jul 24, 2009 $7.25

Comments